
The pursuit of high precision, rigidity, and compactness in industrial automation has positioned the Rotate-Vector (RV) reducer as a critical component in robotic joint drives. Its performance, particularly its transmission accuracy and longevity under load, directly influences a robot’s positioning precision, motion stability, and operational reliability. This article presents an in-depth investigation into the transmission accuracy of the RV reducer, combining empirical testing of a commercial unit with the development and validation of a high-fidelity virtual prototype model. The core objective is to establish a simulation methodology that accurately reflects real-world behavior by integrating key influencing factors such as manufacturing errors, assembly errors, clearances, and component flexibility.
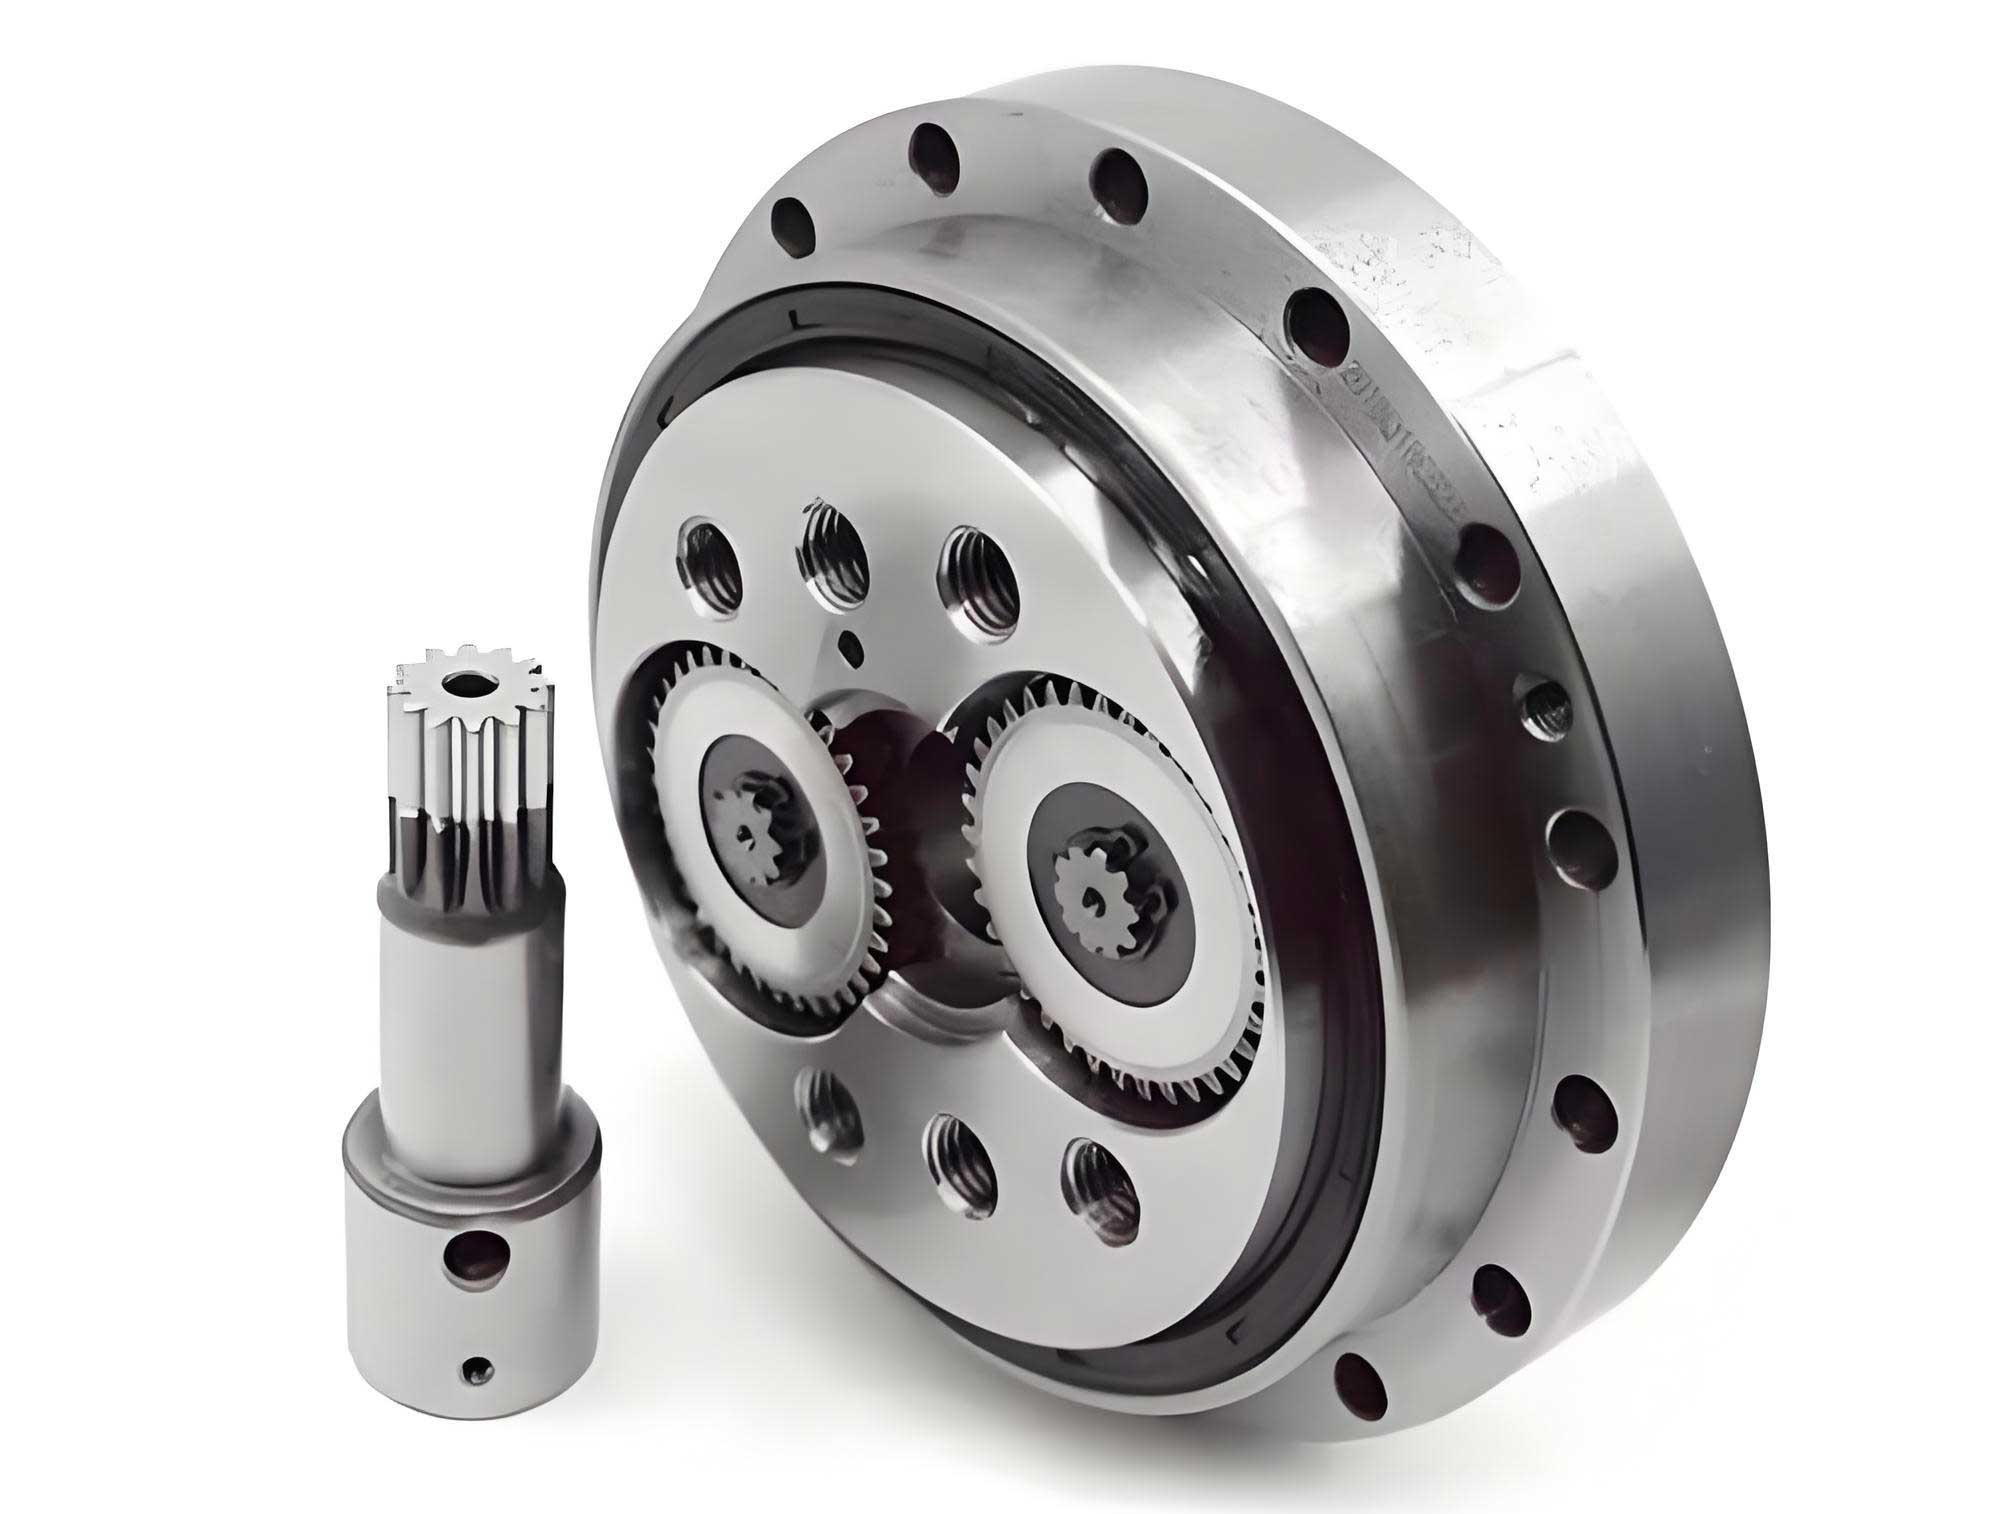
The unique advantage of the RV reducer lies in its two-stage compounded structure. The first stage is a standard involute planetary gear train, which provides an initial speed reduction. The second, and primary reduction stage, is a cycloidal-pinwheel (or摆线针轮) mechanism. This design is key to the RV reducer’s high torque density, torsional stiffness, and high reduction ratio within a compact envelope. The output is typically taken from the planetary carrier of the cycloidal stage. Understanding this kinematic chain is fundamental to analyzing error propagation.
Experimental Characterization of RV Reducer Transmission Accuracy
To establish a ground-truth baseline, transmission accuracy testing was conducted on a commercially available RV reducer model. The primary metric evaluated is the transmission error (TE), defined as the deviation between the actual output shaft position and its theoretically ideal position for a given input.
Testing Principle and Setup
The testing employed the grating measurement method. High-precision rotary optical encoders (Heidenhain ROD series) were coupled to both the input and output shafts of the RV reducer system. A dedicated transmission chain analyzer acquired and processed the real-time signals from both encoders. The system calculated the positional difference, yielding the cumulative transmission error curve. A schematic of this principle is shown below.
Test Configuration Components:
- Device Under Test (DUT): A commercial RV-40E type reducer. Configuration: 2 planetary gears, 2 crank shafts, 2 cycloidal gears phased 180°, fixed pinwheel, rotating carrier output. Ratio: 121.
- Input Drive: A servo motor with integrated encoder.
- Measurement Encoders: High-resolution optical encoders on both input and output shafts.
- Couplings: Precision elastic couplings to minimize alignment-induced error.
- Data Acquisition: Specialized transmission error testing hardware and software.
The specific parameters fed into the measurement system are summarized in Table 1.
| Parameter | Input Shaft (Reference) | Output Shaft (Measurement) |
|---|---|---|
| Encoder Type | Rotary Optical Encoder | Rotary Optical Encoder |
| Line Count | 36,000 | 18,000 |
| Electronic Multiplication | 20 | 5 |
| System Transmission Ratio | 1.00000 | 121 |
Test Procedure and Results
The RV reducer was installed on the test bench and connected. The test was conducted with the output shaft rotating at 15 RPM. Data was collected over two full revolutions of the output shaft (approximately 10 seconds). Tests were performed for both forward (increasing encoder count) and reverse rotation directions to capture hysteresis effects.
The resulting transmission error curves are graphical outputs of the analyzer. For the tested RV reducer operating at 15 RPM, the maximum cumulative transmission error was found to be approximately 56 arc-seconds for forward rotation and 57 arc-seconds for reverse rotation. These measured values serve as the critical benchmark for validating the accuracy of the subsequent virtual prototype simulation.
Development of a High-Fidelity Virtual Prototype for the RV Reducer
To enable predictive analysis and understand the contribution of various error sources, a multi-body dynamics model of the RV reducer was developed using simulation software (ADAMS). The goal was to create a “virtual twin” whose simulated transmission error closely matched the experimentally measured data.
3D Geometric Modeling and Error Definition
A detailed 3D CAD model of the RV reducer was first created based on the physical dimensions and assembly relationships of the commercial unit. The model includes all core components: input sun gear, planetary gears, crank shafts, cycloidal disks, pinwheels (pins housed in a shell), and the output carrier.
Critical to the model’s fidelity is the incorporation of real-world imperfections. Through metrology and analysis of the physical RV reducer, estimates for key errors were obtained and implemented. These are summarized in Table 2.
| Error Source Description | Magnitude (μm) | Notes |
|---|---|---|
| Sun Gear Base Circle Eccentricity | 10 | |
| Sun Gear Assembly Runout | 5 | |
| Planetary Gear Base Circle Eccentricity | 10 | |
| Pin Hole Position Error on Pin Shell | ±8 | Radial deviation of pin seat. |
| Pin Diameter Error | -8 | Negative indicates undersized pin. |
| Carrier Crank Bore Eccentricity | 5 | |
| Carrier Assembly Runout | 5 | |
| Pin Shell Raceway Radius Error | 10 | |
| Crank Shaft Eccentricity Error (Two Shafts) | -2 / +2 | Different errors per shaft to simulate imbalance. |
| Bearing Radial Internal Clearance | 12 | Modeled as a combined kinematic play. |
Modeling Component Flexibility and Complex Joints
Treating all components as rigid bodies is insufficient for predicting dynamic transmission error, as elastic deformations under load significantly affect meshing conditions. Therefore, a flexible multi-body dynamics approach was adopted. Critical load-bearing components—namely the cycloidal disks, the pinwheel housing, and the output carrier—were converted into flexible bodies using Finite Element Analysis (FEA). Their modal neutral files (MNF) were generated and imported into the dynamics model, creating a rigid-flexible coupled virtual prototype of the RV reducer.
The most challenging aspect was modeling the bearing connections, particularly between the crank shaft eccentric journals and the cycloidal disk bores. A simple revolute joint ignores clearance and contact stiffness. A pure contact force model is computationally expensive and may not capture damping effects. The chosen method utilizes a Bushing Force element combined with a conditional logic function.
The Bushing force ($\mathbf{F}_{b}$) between two markers ($i$ on crank, $j$ on cycloidal disk) is defined by a 6×6 stiffness matrix $[K]$, a 6×6 damping matrix $[C]$, and preload $\mathbf{F}_0$:
$$
\mathbf{F}_{b} = [K] \cdot \mathbf{\delta} + [C] \cdot \mathbf{\dot{\delta}} + \mathbf{F}_0
$$
where $\mathbf{\delta} = [\Delta x, \Delta y, \Delta z, \Delta \theta_x, \Delta \theta_y, \Delta \theta_z]^T$ is the relative displacement/rotation vector and $\mathbf{\dot{\delta}}$ is its time derivative.
To model radial clearance $\epsilon$, the radial translational stiffness $k_{radial}$ is defined using a conditional (IF) statement:
$$
k_{radial} = \text{IF}( d_{ij} – \epsilon : 0, 0, k_n )
$$
where $d_{ij}$ is the radial distance between markers $i$ and $j$, and $k_n$ is the nominal contact stiffness. This formulation means:
If $d_{ij} \le \epsilon$ (within clearance zone), the stiffness is zero, allowing free movement.
If $d_{ij} > \epsilon$ (contact occurs), the full contact stiffness $k_n$ is applied.
The damping coefficients in $[C]$ can be tuned to represent the lubricant damping effect within the bearing. This approach efficiently captures the nonlinearity of clearance while maintaining computational stability.
Defining Kinematic Constraints and Simulation Setup
Joints and constraints were applied to replicate the actual RV reducer kinematics:
- A revolute joint connects the input shaft/carrier to ground.
- Gear pair constraints define the meshing between the sun gear and the two planetary gears.
- Fixed joints connect planetary gears to their respective crank shafts.
- The Bushing elements, as described, connect each crank shaft journal to its corresponding bore in the two cycloidal disks.
- Revolute joints connect the crank shafts to the output carrier.
- Planar joints allow the cycloidal disks to rotate and translate in-plane relative to ground, necessary for their eccentric motion.
- Contact forces are defined between the tooth profiles of the cycloidal disks and each pin on the pinwheel.
A constant rotational velocity was applied to the input shaft, ramping up from zero using a STEP function to avoid impulsive starts. A constant load torque of 412 N·m, corresponding to the reducer’s rated capacity, was applied to the output carrier. The simulation was run for sufficient time to capture multiple output revolutions under steady-state conditions.
Simulation Results and Model Validation
The primary output of the virtual prototype simulation is the time-history of the output carrier’s angular position error. The simulated transmission error curve for the RV reducer under load exhibited a periodic pattern corresponding to the cycloidal gear mesh frequency and its harmonics.
The key validation metric was the peak-to-peak amplitude of the simulated transmission error. The simulation yielded a maximum transmission error variation of approximately 1.09 arc-minutes over two output revolutions.
Comparison with Experimental Data:
This simulated result (1.09 arc-min ≈ 65.4 arc-seconds) shows excellent agreement with the experimentally measured maximum error of ~56-57 arc-seconds. The difference is approximately 8-9 arc-seconds, or about 0.13 arc-minutes. This close correlation validates the fidelity of the virtual prototype. It confirms that the modeling approach—which integrated measured error magnitudes, component flexibility, and a sophisticated bearing clearance model—successfully captures the dominant physical phenomena governing the transmission accuracy of the RV reducer.
Comprehensive Analysis of Error Sources and Impact
With a validated model, we can decompose the contributions to the overall transmission error. The total error $TE_{total}$ in the RV reducer can be conceptualized as the superposition of errors from various sources:
$$
TE_{total} = TE_{gear1} + TE_{cyclo} + TE_{comp} + TE_{bear} + TE_{flex}
$$
Where:
$TE_{gear1}$ is the error from the first-stage planetary involute gears (eccentricity, pitch error).
$TE_{cyclo}$ is the error from the cycloid-pinwheel stage (pin position error, cycloid profile deviation).
$TE_{comp}$ is the error from component assembly misalignment (runout).
$TE_{bear}$ is the error due to bearing clearances and compliance.
$TE_{flex}$ is the error induced by elastic deformation of components under load.
The virtual prototype allows for parametric studies. For instance, by selectively “turning off” certain error inputs in the simulation (e.g., setting all manufacturing errors to zero but retaining bearing clearance and flexibility), the individual contribution of each source can be quantified. Typically, for a high-precision RV reducer, the cycloid-pin mesh errors ($TE_{cyclo}$) and the bearing-related nonlinearities ($TE_{bear}$) are among the most significant contributors to the dynamic transmission error. The phase relationship between errors on the two crank shafts also plays a crucial role in error cancellation or amplification.
Conclusion and Future Research Directions
This integrated study successfully bridges experimental measurement and advanced simulation for the RV reducer. The development and validation of a high-fidelity virtual prototype that incorporates manufacturing imperfections, assembly errors, bearing clearances, and component flexibility provides a powerful tool for the analysis and design of these precision drives.
Key outcomes include:
- Experimental Benchmarking: Established precise transmission error data for a commercial RV reducer under operational conditions.
- Validated Simulation Framework: Created a robust multi-body dynamics model of the RV reducer whose output matches physical test results with high accuracy (error ~0.13 arc-min).
- Advanced Joint Modeling: Implemented an effective method using Bushing forces with conditional stiffness to model bearing clearance nonlinearity, which is critical for accuracy prediction.
Future work can leverage this validated virtual prototype for numerous advanced studies:
- Parametric Sensitivity Analysis: Systematically varying individual error magnitudes (e.g., pin diameter, crank eccentricity) to establish tolerance guidelines for manufacturing and assembly.
- Dynamic Load and Lifetime Prediction: Simulating varying load spectra to predict dynamic behavior, stress cycles, and fatigue life, contributing to reliability-centered design.
- Thermo-Mechanical Analysis: Coupling the dynamics model with thermal models to study the effect of temperature rise on clearances, lubricant viscosity, and resultant accuracy.
- Optimal Design Exploration: Using the model as a digital testbed for optimizing cycloid tooth profile modifications or bearing preload strategies to minimize transmission error and hysteresis.
- Fault Diagnosis and Prognostics: Introducing simulated faults (e.g., wear, spalling) into the model to study their characteristic signatures in the transmission error signal, aiding in condition monitoring.
In conclusion, the methodology presented provides a comprehensive foundation for the virtual design, performance prediction, and accuracy enhancement of the RV reducer, a cornerstone component in modern high-performance robotics. This approach moves beyond traditional static error analysis, enabling a dynamic, system-level understanding that is essential for pushing the boundaries of precision in robotic actuation.